
Data warehousing
Data from every system cleaned and consolidated into one reliable source.
- Data pipelines
- Data modelling
- Data governance


We bring scattered data into a single warehouse and turn it into executive dashboards, KPI monitoring and analytics your leadership team actually uses.
We build the pipeline, the model and the dashboards, so the numbers in every meeting match.
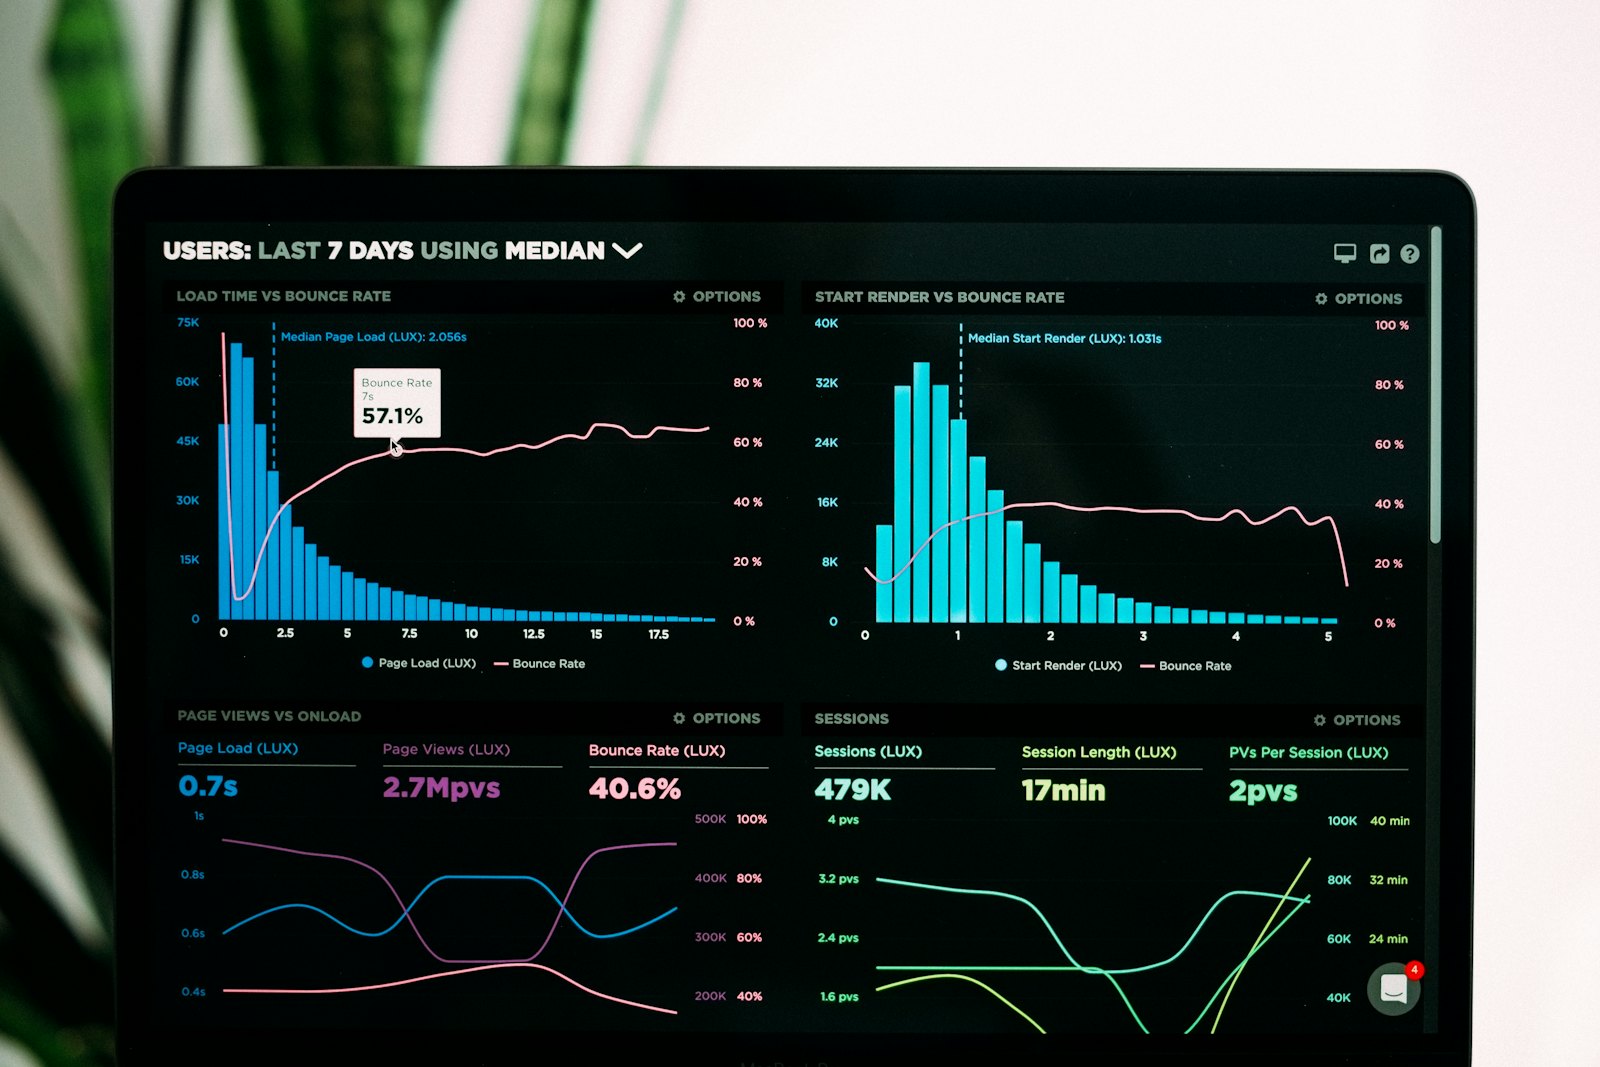
Data from every system cleaned and consolidated into one reliable source.
Interactive dashboards that show leadership what matters, at a glance.
Targets tracked automatically, with alerts when something drifts.
Understand who buys, why they stay and which channels drive revenue.
Visibility into costs, margins, throughput and turnaround times.
Forecasts that help you plan stock, staffing and budgets ahead of demand.
The same sequence on every engagement, so you always know what happens next and what it delivers.
Inventory data sources, check quality and agree the KPIs that matter.
Build pipelines into a governed warehouse with a clear data model.
Design dashboards with the people who will use them every week.
Train teams and build the habit of running reviews from live data.
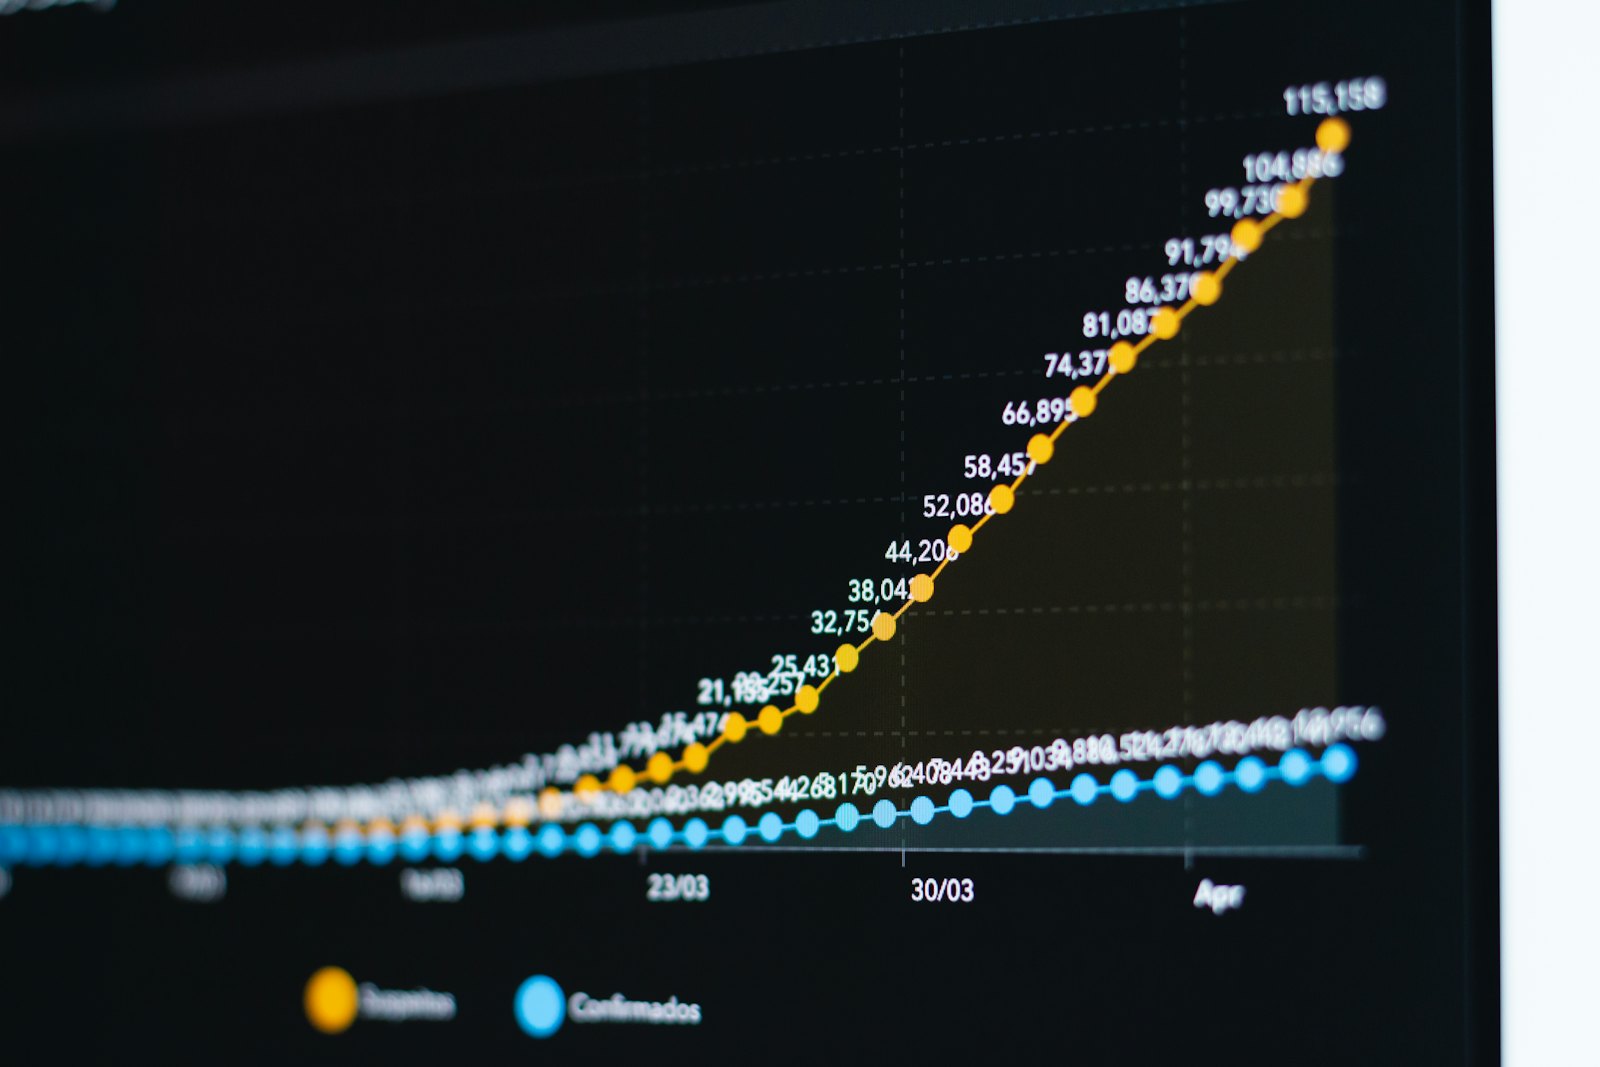
Every team reports from the same source, so meetings start from agreement.
Performance is visible today, not at month end.
Drifting KPIs trigger alerts while there is still time to respond.
Reports that were assembled by hand now refresh themselves.
Forecasts inform stock, staffing and budget decisions.
Clean, governed data is the foundation every AI project needs.
See what comes before and after it on the enterprise evolution roadmap.
Tell us where things stand today. A strategist will reply within one business day with next steps — no automated sales sequence.